 (888) 815-0802
Expert Inside Sales Metric: Win Rate
For our latest eBook, we asked sales leaders to reveal a must-track metric that is essential for optimizing sales success. The following is a guest post by Mike Schultz, Co-President of RAIN Group.
The RAIN Group Center for Sales Research surveyed 472 sellers and sales executives representing companies with salesforces ranging in size from 10 sellers to 5,000+. Among other things, we wanted to know: what is the average sales win rate, and how do win rates vary based on overall performance?
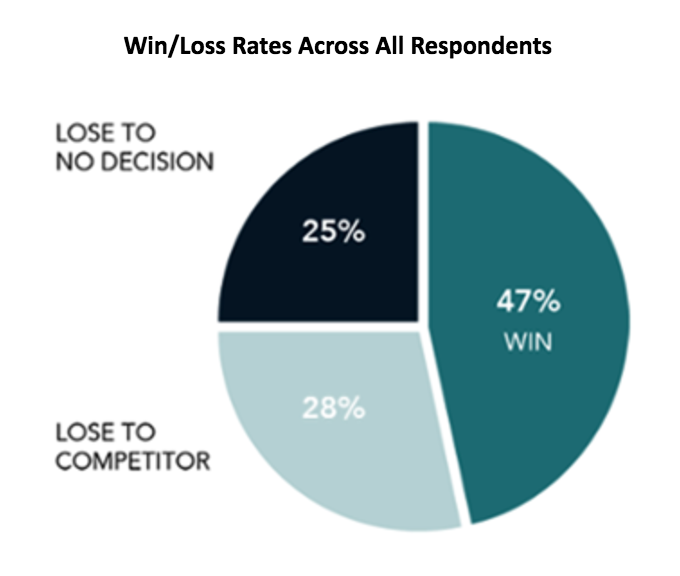
Across all respondents, the average win rate is 47%.
Win/Loss Rates Across All Respondents
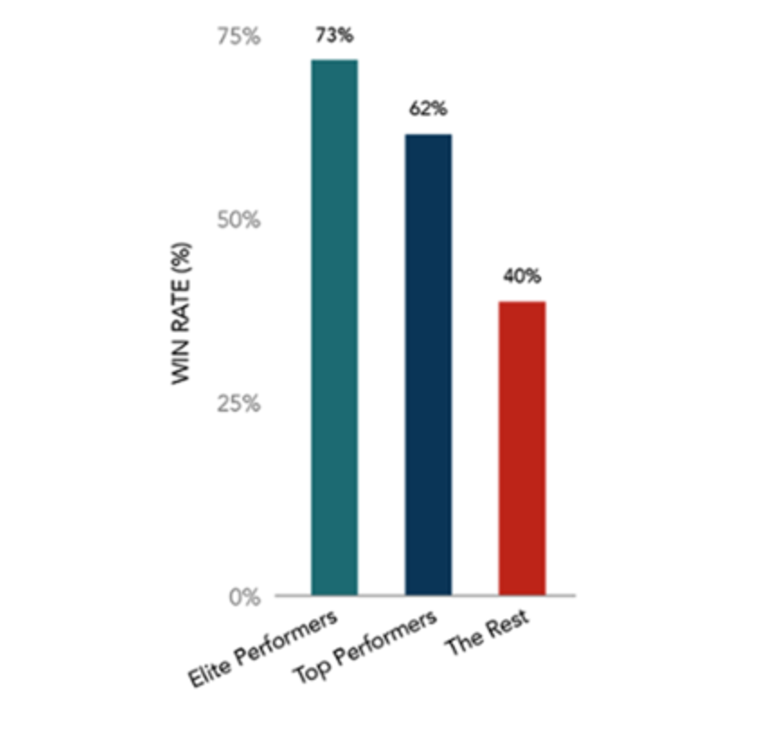
We broke respondents down into 3 groups based on their sales results: Elite Performers (representing the top 7% of respondents), Top Performers (representing the top 20%), and The Rest (representing the remaining 80%). When we look at win rate by each performance group, the differences are surprisingly large.
Top Performance and Win Rate
Let’s now assume a company has the following:
- # of sellers: 200
- # of proposals/year/seller: 25
- Average size of sale: $150,000
Look at the difference in revenue by win rate comparing the win rate of The Rest (40%) with Top Performers (62%):
The Win Rate Difference
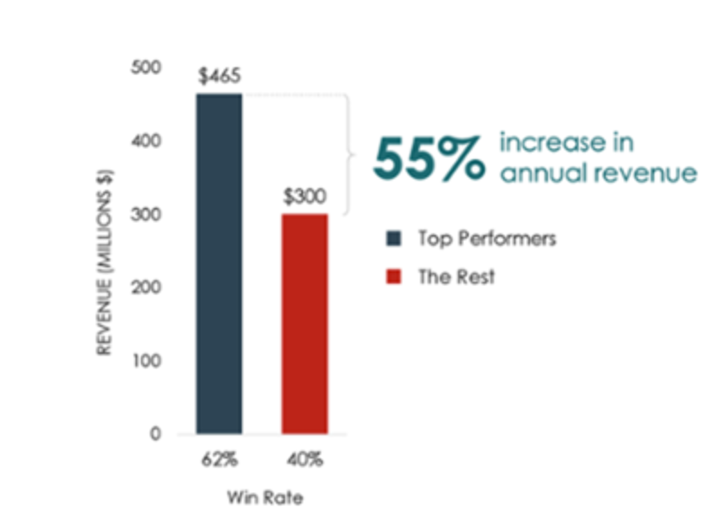
At a win rate of 40%, this organization’s annual revenue is $300 million. At 62%, it’s $465 million.
That’s 55% growth for the whole company without adding any sales headcount—just by increasing the win rate.
Want more metrics from top sales experts? Check out our free eBook, The Complete Guide to Inside Sales Analytics (2017 Edition).


